|
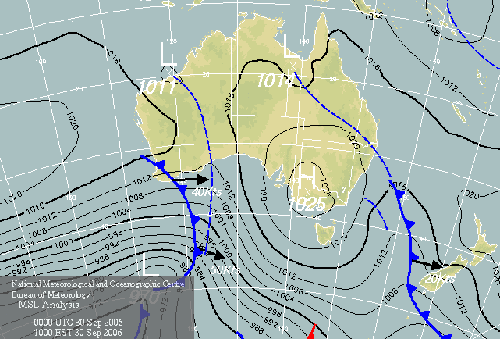
As described on the Home page, the formation of a low pressure trough through Northern Queensland and an associated high pressure ridge along the Cape York Peninsula is required the day before a Morning Glory. The MSL analysis chart to your right is a classic example of this. This trough shown here encourages the formation of seabreezes around the Gulf and a prevailing north easterly flow. |
 |
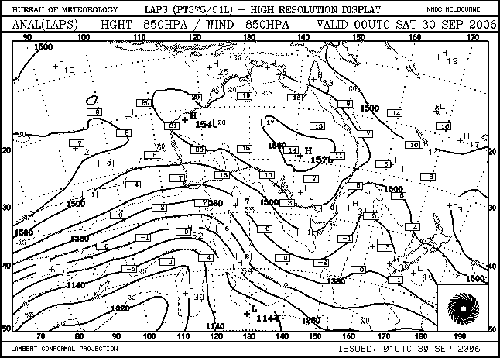
The upper air charts show a marked veering of the winds aloft
in the SE Gulf region above the lower seabreezes. |

|
|
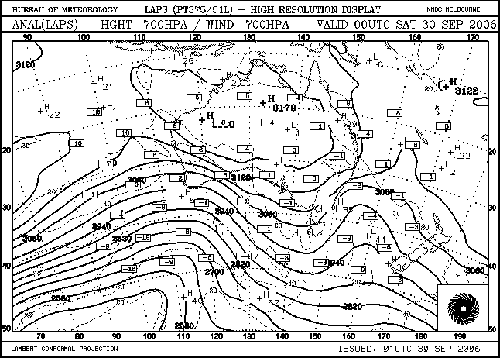
At 10,000ft the 700hPa analysis chart shows the wind getting around to wards southerly. This mid level high pressure system is generally only associated with dry season weather and the underlying sea level trough tends to be a wet season phenomenon. Once these mid level highs disappear in late October, this effectively “lifts the lid” on convection and the thunderstorm season commences. |

|
|
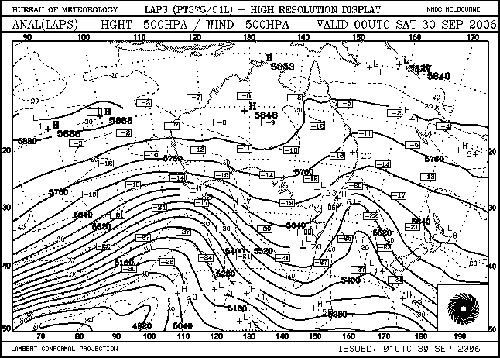
By the time we get to 18,000ft the winds are around further to the south west as shown on this 500hPa analysis chart. |

|
|
These videos need flash player installed. |
|
The video to the right is part of a video sequence taken from Burketown looking towards Normanton as a poorly formed Morning Glory system is passing. The upper standing wave system that can be seen has a curve on it that approximates the south eastern corner of the Gulf. |
Little research has been done to determine the effect of upper air wave systems in the formation of Morning Glory Clouds. The upper air inversions and flows are certainly important in providing appropriate wave guides for the Morning Glories and the upper air synoptic charts on "Glory Days" are always similar to the ones shown above. It has been a puzzle as to how the Morning Glory manages to travel so far without dispersing it's energy. The upper inversions certainly provide a "lid" on the Glory but it may be possible that the upper atmosphere wave systems also have some effect in inputing energy to multiple Glory waves. More 3D modelling is required.